 Education News
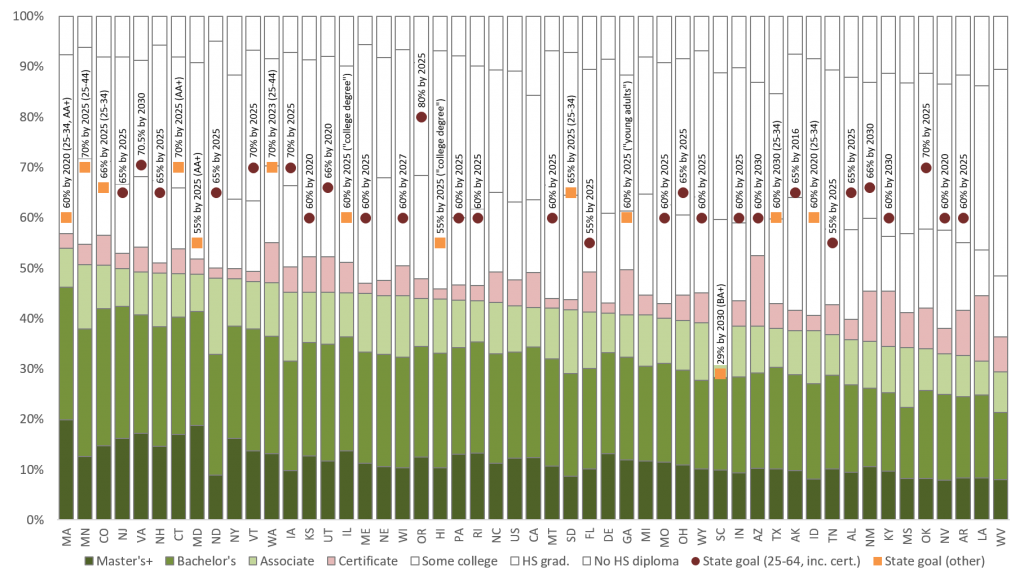
Graphic: Post Secondary Attainment Rates
State-by-State Post-Secondary Attainment Rates and Goals
From ITHAKA S+R “Setting a North Star: Motivations, Implications, and Approaches to State Postsecondary Attainment Goals”, June 12, 2019. Cindy Le, et.al.
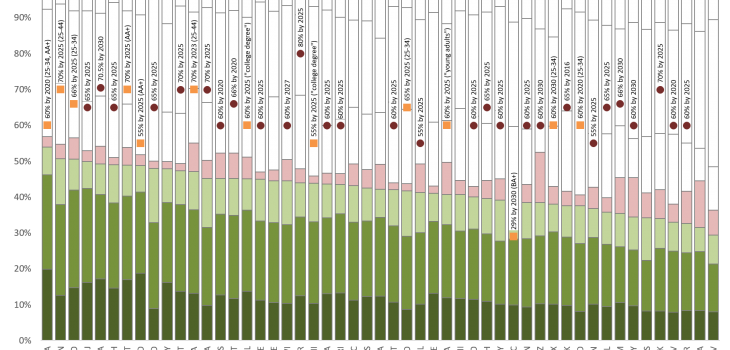
The graphic above, shows the variation in states’ current levels of attainment and their corresponding attainment goals. Massachusetts and Colorado have the highest attainment rate when all post-secondary credentials are counted (including, bachelors, associates, and workforce-relevant certificates). States’ attainment levels are influenced by several factors, including the net migration patterns of educated persons, so states’ goals and approaches to increasing attainment levels naturally vary. As shown below, some states’ attainment goals are more ambitious than others – with Oregon’s attainment goal of 80 percent far exceeding other states. Goals indicated by a maroon circle are aligned to the Lumina Foundation’s national goal in terms of the age range (25-64) and set of credentials assessed (including certificates). Goals indicated by an orange square are either based on a different age range or are focused on a different set of credentials than the Lumina national goal. Click on the graphic to see high resolution image.
Read the entire issue brief.


